Segmentation Fault (Core Dumped): What Does It Mean?

 Total View: 56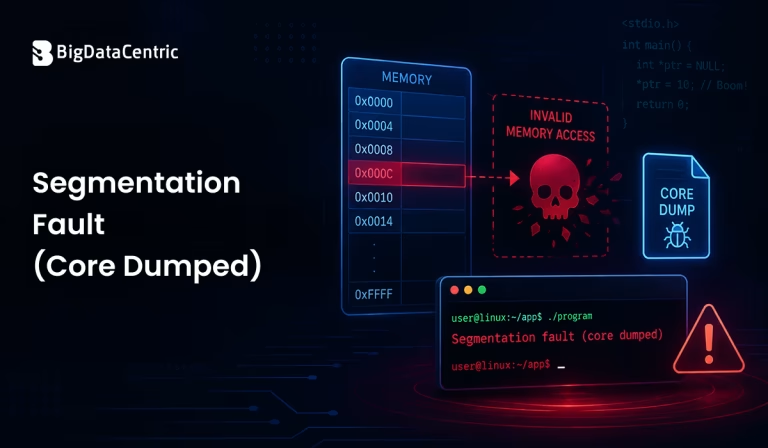
Submitting the form below will ensure a prompt response from us.
A segmentation fault (core dumped) is a common runtime error that occurs when a program attempts to access a memory location it is not permitted to use. It is particularly common in languages such as C and C++, where developers have direct control over memory through pointers, arrays, and dynamic allocation.
When this error occurs, the operating system terminates the program to prevent it from corrupting other memory. The message may appear in a terminal as:
Segmentation fault (core dumped)
The phrase “core dumped” means that the operating system may have created a core dump containing information about the program’s state when it crashed. This information can be useful for debugging.
What is a Segmentation Fault?
A segmentation fault, often abbreviated as segfault, happens when a program tries to access memory outside the boundaries or permissions assigned to it.
For example, dereferencing an invalid pointer can cause a segmentation fault:
#include

int main() {

int *ptr = NULL;

printf("%d\n", *ptr);

return 0;

}
Here, ptr contains a null address. Attempting to read the value using *ptr causes the program to access an invalid memory location.
The operating system detects the invalid access and terminates the program.
What Does “Core Dumped” Mean?
A core dump is a file containing information about a process at the time it crashes. It can include details such as:
- Memory information
- CPU register values
- Stack information
- Program state
- Threads
- Variable and function information, when debugging symbols are available
For example:
Segmentation fault (core dumped)
does not necessarily mean that a core dump file is always available. Whether one is generated depends on the operating system configuration and settings such as the core dump size limit.
On Linux, you can check the current core dump limit with:
ulimit -c
A value of 0 generally means core dumps are disabled for the current shell.
You can enable core dumps for the current shell with:
ulimit -c unlimited
What Causes a Segmentation Fault?
There are several common causes of a segmentation fault.
Dereferencing a NULL Pointer
A program may attempt to access memory through a pointer that contains NULL. For related C programming concepts, you can also learn how to convert a C string to an integer and handle string-based data safely.
#include

int main() {

int *number = NULL;

*number = 100;

return 0;

}
The statement *number = 100 attempts to write through a null pointer.
A safer approach is to check the pointer before dereferencing it:
if (number != NULL) {

*number = 100;

}
Accessing an Array Outside Its Bounds
Accessing an invalid array index can result in undefined behavior and may eventually cause a segmentation fault.
#include

int main() {

int values[3] = {10, 20, 30};

printf("%d\n", values[10]);

return 0;

}
The valid indexes are 0, 1, and 2. Index 10 is outside the array.
Use the correct bounds when accessing arrays:
for (int i = 0; i < 3; i++) {

printf("%d\n", values[i]);

}
Using a Dangling Pointer
A dangling pointer refers to memory that has already been released.
#include

int main() {

int *value = malloc(sizeof(int));

*value = 42;

free(value);

*value = 100;

return 0;

}
After free(value), the pointer should no longer be dereferenced.
A useful practice is to set the pointer to NULL after releasing its memory:
free(value);

value = NULL;
Stack Overflow
A function that recursively calls itself without a suitable termination condition can consume the available stack space.
void process() {

process();

}

int main() {

process();

return 0;

}
This eventually exhausts the stack and can result in a segmentation fault.
Recursion should always have a valid base condition:
void process(int count) {

if (count <= 0) {

return;

}

process(count - 1);

}
Incorrect Pointer Arithmetic
Incorrect manipulation of pointers can cause a program to access memory outside the intended region.
int values[5] = {1, 2, 3, 4, 5};

int *ptr = values;

printf("%d\n", *(ptr + 10));
The pointer is moved beyond the valid array range, resulting in undefined behavior.
How Do You Fix “Segmentation Fault (Core Dumped)”?
The correct solution depends on what caused the invalid memory access. The first step is to identify the exact location where the program crashes.
Step 1: Compile With Debugging Information
For a C program, compile with the -g option:
gcc -g program.c -o program

For C++:

g++ -g program.cpp -o program
Debug symbols allow debugging tools to associate machine instructions with source code.
Step 2: Run the Program With GDB
GNU Debugger (GDB) can help identify where the program crashed.
Start the program with:
gdb ./program
Inside GDB, run:
run
If the program crashes, use:
backtrace

or:

bt
You may see output similar to:
Program received signal SIGSEGV, Segmentation fault.
#0  process_data () at program.c:15

#1  main () at program.c:28
This indicates that the crash occurred around line 15 of program.c.
You can then inspect the relevant code and variables.
Step 3: Use AddressSanitizer
AddressSanitizer is particularly useful for finding memory-related problems in C and C++ programs.
Compile with:
gcc -g -fsanitize=address program.c -o program
Then run:
./program
AddressSanitizer can detect problems such as:
- Out-of-bounds memory access
- Use-after-free
- Stack buffer overflow
- Heap buffer overflow
- Some memory leaks
For example, if an array is accessed beyond its allocated size, AddressSanitizer can report where the invalid access occurred.
Step 4: Check Pointer Values
When pointers are involved, verify that they are initialized and point to valid memory.
Instead of:
int *data;

printf("%d\n", *data);
allocate and initialize the required memory:
int value = 25;

int *data = &value;

printf("%d\n", *data);
Step 5: Check Memory Allocation
Dynamic memory allocation should always be checked.
#include

#include

int main() {

int *data = malloc(100 * sizeof(int));

if (data == NULL) {

fprintf(stderr, "Memory allocation failed\n");

return 1;

}

data[0] = 100;

free(data);

data = NULL;

return 0;

}
This prevents the program from blindly using a failed allocation.
How Can You Debug a Core Dump?
If the operating system generates a core dump, you can inspect it using GDB.
For example:
gdb ./program core
Then use:
bt
to display the call stack.
You can inspect the current frame with:
frame 0
and examine variables with:
print variable_name
For example:
print ptr
You can also inspect source code around the current location:
list
This can help determine which pointer, array, or memory operation caused the crash.
How Is a Segmentation Fault Different From a Compilation Error?
A compilation error occurs while the source code is being compiled. A segmentation fault normally occurs while the compiled program is running.
For example, this produces a compilation error:
#include

int main() {

printf("Hello"

return 0;

}
The syntax is incomplete, so the compiler reports an error.
By contrast, this program can compile successfully but crash at runtime:
#include

int main() {

int *ptr = NULL;

printf("%d\n", *ptr);

return 0;

}
The difference is important because debugging approaches are different. Compilation errors require fixing source-code syntax or type problems, while segmentation faults generally require investigating runtime memory access.
Common Ways to Prevent Segmentation Faults
Developers can reduce the risk of segmentation faults by following good memory-management practices.
Initialize Pointers
Avoid using uninitialized pointers:
int *ptr = NULL;
Initialize them with valid addresses before dereferencing them.
Validate Array Boundaries
Always ensure indexes remain within the allocated range:
if (index >= 0 && index < size) {

data[index] = value;

}
Free Dynamically Allocated Memory Carefully
Release memory when it is no longer needed:
free(data);

data = NULL;
Avoid accessing the pointer after it has been freed.
Use Debugging and Sanitizing Tools
Tools such as GDB and AddressSanitizer can identify memory problems much earlier than simply examining the final crash message.
Quick Reference: Segmentation Fault Debugging
| Problem | Possible Cause | Useful Approach |
|---|---|---|
| Null pointer access | Pointer is NULL | Validate pointer |
| Array crash | Out-of-bounds index | Check array boundaries |
| Heap corruption | Invalid allocation/access | Use AddressSanitizer |
| Use-after-free | Memory already released | Track ownership/lifetime |
| Recursive crash | Stack exhaustion | Add a termination condition |
| Unknown crash location | Runtime memory error | Use GDB backtrace |
| Core dump available | Process crashed | Inspect with GDB |
Need Help Debugging Segmentation Faults?
Identify memory-access issues, runtime crashes, and core dumps with systematic debugging and reliable development practices.
Conclusion
A segmentation fault (core dumped) indicates that a program attempted an invalid memory operation and was terminated by the operating system. Common causes include null-pointer dereferencing, out-of-bounds array access, use-after-free errors, invalid pointer arithmetic, and stack exhaustion.
When debugging a segmentation fault, start by reproducing the problem and identifying the crashing line. Compiling with debugging symbols and using GDB, AddressSanitizer, or similar diagnostic tools can make the underlying problem much easier to locate.
The most effective long-term approach is to combine careful pointer and memory management with automated debugging and memory-safety checks throughout the development process.


Jayanti Katariya is the CEO of BigDataCentric, a leading provider of AI, machine learning, data science, and business intelligence solutions. With 18+ years of industry experience, he has been at the forefront of helping businesses unlock growth through data-driven insights. Passionate about developing creative technology solutions from a young age, he pursued an engineering degree to further this interest. Under his leadership, BigDataCentric delivers tailored AI and analytics solutions to optimize business processes. His expertise drives innovation in data science, enabling organizations to make smarter, data-backed decisions.